We are in danger of creating an unstoppable CO^2 release, Bogan. You asked for a chart that showed that CO^2 and Temperature rose at the same time. I provided that graph with a link to where I found it. Please address your original point, rather than skipping all over the countryside. Does rises in CO^2 cause rises in temperature? Yes/No.Bogan wrote: ↑Sat Aug 31, 2019 7:26 pmThank you Brian for completely ignoring my post and just cutting and pasting an article which supports your view. This supports my belief that you have never thought about anything you have read (if you have even bothered to read it in the first place) and you simply don't understand what is going on.
Brian, if CO2 causes temperature rises, which releases more CO2 from the oceans, which causes temperature rises, which causes more CO2 to be released from the oceans, which causes etc etc. You have already got an unstoppable runaway greenhouse effect. But your own graph shows that we never get an unstoppable greenhouse effect. That is because CO2 does not cause temperature rises. It is temperature rises which causes CO2 to levels to rise. And that CO2 must have little to no effect on temperatures because eventually, the temperatures go down again and take CO2 levels down with them. Look at your own graph. Something other than CO2 must be controlling temperature rises and falls.
Therefore, temperatures must be controlling CO2, not the other way around.
If you think that CO2 causes temperatures to rise, then what is causing CO2 levels to (regularly as clockwork) crash when they are already on a runaway greenhouse trajectory, and take the temperatures down with them? Unless you can answer that, I have got you right where I want you.
Climate Change
-
brian ross

- Posts: 6059
- Joined: Thu Apr 19, 2018 6:26 pm
Re: Climate Change
Nationalism is not to be confused with patriotism. - Eric Blair
-
Bogan

- Posts: 948
- Joined: Sat Aug 24, 2019 5:27 pm
Re: Climate Change
Brian, CO2 is a greenhouse gas, but it is the least significant gas in terms of warming effects, and it is only a trace gas in the atmosphere. It is bugger all. If you double or triple bugger all, you still get bugger all. The question really is, whether the human release of CO2 is causing global temperatures to rise. And the evidence I see is that it does not. That does not mean that we should not be concerned about changing the atmospheric composition, and at least start thinking seriously of alternatives to fossil fuels. But the technology is not there yet, and the people who scream the loudest about HIGW are opposed to every other form of clean energy also.
Back to the graphs.
The graph I submitted clearly showed that (at least in high concentrations), there is no causal link between CO2 and global temperatures at all. For 570 million years CO2 sometimes went down when temperatures went up, and sometimes CO2 went up when temperatures went down. Sometimes CO2 went up when temperatures went up. And sometime temperatures went down when temperatures went down. Conclusion? There does not appear to be any direct relationship to CO2 and global temperatures at all.
Now to your graph which shows a direct relationship between CO2 and global temperatures when CO2 levels are at very low concentrations. And for the last 10 million years CO2 has been at it's lowest concentration for 570 million years. The alarmists claim this shows that CO2 leads temperatures. But sceptics say it proves that temperatures lead CO2.
Who is right? I say that the sceptics are clearly right because it proves that something other than C02 is affecting global temperatures, and the close relationship between CO2 and global temperatures rising and falling in lockstep with each other can be accounted for if temperatures lead CO2 levels. That explanation is credible, and easy to understand.
Alarmists who claim that the graph proves that CO2 leads global temperatures need to come up with an explanation as to how rising CO2 levels suddenly reverse and global temperatures go down in lockstep with it. If you can't explain why that occurs, then it sure looks like the sceptics premise is the right one. Go to it, Brian. explain how CO2 levels suddenly reverse for no reason when they should just keep rising forever until Earth looks like Venus. You won't find any "scientific" explanations because the alarmists don't want to explain what they know can't explain.
-
brian ross
- Posts: 6059
- Joined: Thu Apr 19, 2018 6:26 pm
Re: Climate Change
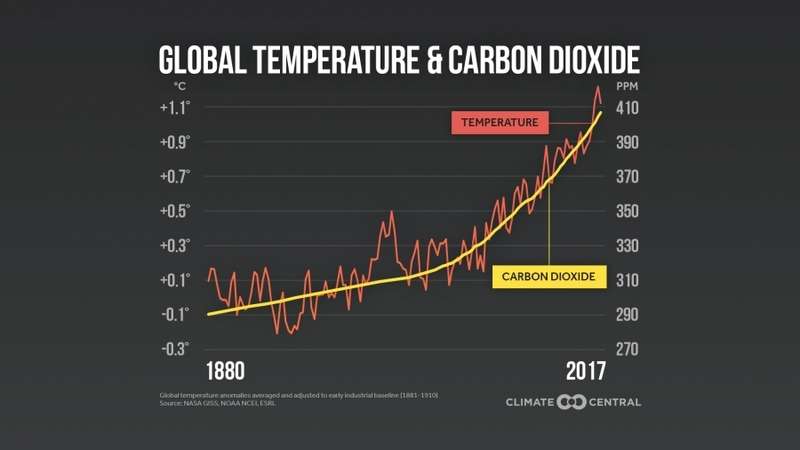
CO^2 rises when Temperature rises. There is a clear correlation. No matter how you attempt to explain it away, Bogan the scientific facts are that when CO^2 rises, so does temperature. What causes the rises in CO^2? Man's burning of fossil fuels. All you're doing is twittering away while the climate changes because of man's actions. Tsk, tsk.
Nationalism is not to be confused with patriotism. - Eric Blair
-
Bogan
- Posts: 948
- Joined: Sat Aug 24, 2019 5:27 pm
Re: Climate Change
Oh Brian, I only got an "O" in year 10 maths, but I know how to read a graph. Your lame read of the graphs actually got me giggling.
I am just a dumb electrician, Brian. But I know when somebody is pissing on my leg and telling me that it is raining.
Too begin with, the most important of your graphs, the one which plots CO2 to global temperatures, is obviously wrong. The earth cooled from 1940 to 1970, which caused climate scientists at that time to predict that the earth was entering a new ice age. That period of global cooling is well known, but somebody simply air brushed it completely away on your CO2 vs. Temp graph. Next, the earth has not warmed since 1998, and I can prove that it has not, at least until 2005 because we have the Climategate emails.
Where on your graph does it show global cooling from 1998 to 2005? Whoever drew that graph did a bit of air brushing for trusting little wokes like you, who they knew would take their lies as the gospel truth, and not bother to check.
Next. If temperatures rise, do CO2 levels rise with it? Yep, you bet. The reason is because the oceans hold 50 times more dissolved CO2 than the atmosphere, and cold water holds more than warm water. So when temperatures rise, you expect that CO2 will rise in concert. But at low concentrations of CO2 as exists in the atmosphere today, it is global temperatures which drive CO2 levels, not the other way around.
But what the duplicitous bastards who drew up your graphs are trying to fool you into thinking, is that their graphs prove that rising CO2 levels causes temperatures to rise. But what really causes global temperature changes are the Malenkovich cycles, differences in the intensity of solar radiation, continental drift, intermittent cosmic rays, and about twenty other damned things that I can't remember.
CO2 does not cause changes in global temperature. Global temperatures change for a lot of reasons. And that affects global CO2 levels.
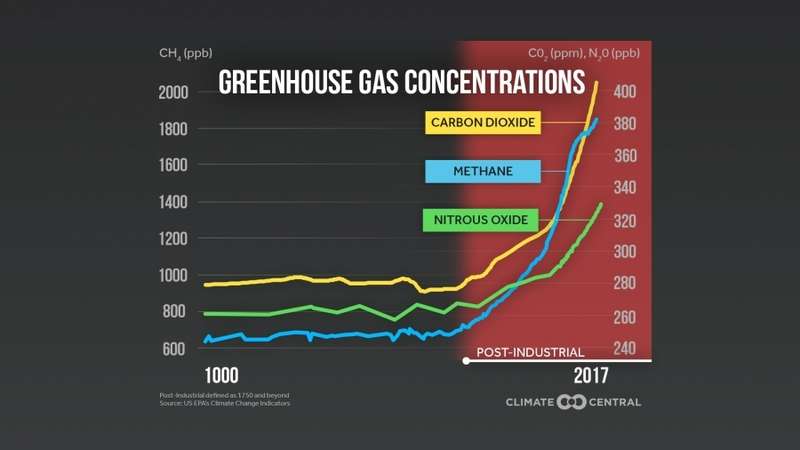
Look at your graphs. First, they are an extremely insignificant sample. One only goes back 140 years, and the other, which does nothing but display that greenhouse gases are rising, only goes back 1017 years. They did not plot temps on that second graph, because they would have had to show the Medieval Warm Period, and they probably hoped that you did not remember that. But either 140 years or 1017 years is an eye blink in time when examining what causes global warming and cooling. You probably got better marks than me in maths, so you must appreciate that you can prove anything with a graph if you take a small enough sample. Especially if you fudge the graph, and one of your graphs is clearly fudged. You are being lied to Brian, and you could not see it. But I could, and I am just a dumb electrician.
If you agree that there must be other causes of global temperature changes, other than just CO2 making the planet warmer, then where on your graphs are these factors displayed? The graphs appear to show that CO2 and other greenhouse gases must be the only possible causes of global temperature rises.
On the scale of 10,000 year cycles, the earth warms and cools roughly every 1000 years. If humans are causing global warming through the release of CO2, then what caused the other 9 warming periods in the last 10,000 years? There must have been 9 other previously unknown industrialised societies on earth belching CO2 and other greenhouse gases to have made the earth warm to the same levels that they are today? Some of those warming periods were warmer than today. And the same factor of previously unknown industrialised civilisations must have happened to explain the thousands of other more warming periods, occurring almost as regular as clockwork for millions of years.
If rising CO2 and other greenhouse gases causes global temperatures to rise, then what makes these gases suddenly disappear and cause global cooling?
Lastly, the graph I submitted to you a few posts back showed global temps and CO2 levels over 570 million years. Which I think you would agree is a better x-axis baseline for a graph than either 140 years or 1017. That graph clearly displayed that there is no correlation between high levels of CO2 and global temperatures.
I am just a dumb electrician, Brian. But I know when somebody is pissing on my leg and telling me that it is raining.
Too begin with, the most important of your graphs, the one which plots CO2 to global temperatures, is obviously wrong. The earth cooled from 1940 to 1970, which caused climate scientists at that time to predict that the earth was entering a new ice age. That period of global cooling is well known, but somebody simply air brushed it completely away on your CO2 vs. Temp graph. Next, the earth has not warmed since 1998, and I can prove that it has not, at least until 2005 because we have the Climategate emails.
Where on your graph does it show global cooling from 1998 to 2005? Whoever drew that graph did a bit of air brushing for trusting little wokes like you, who they knew would take their lies as the gospel truth, and not bother to check.
Next. If temperatures rise, do CO2 levels rise with it? Yep, you bet. The reason is because the oceans hold 50 times more dissolved CO2 than the atmosphere, and cold water holds more than warm water. So when temperatures rise, you expect that CO2 will rise in concert. But at low concentrations of CO2 as exists in the atmosphere today, it is global temperatures which drive CO2 levels, not the other way around.
But what the duplicitous bastards who drew up your graphs are trying to fool you into thinking, is that their graphs prove that rising CO2 levels causes temperatures to rise. But what really causes global temperature changes are the Malenkovich cycles, differences in the intensity of solar radiation, continental drift, intermittent cosmic rays, and about twenty other damned things that I can't remember.
CO2 does not cause changes in global temperature. Global temperatures change for a lot of reasons. And that affects global CO2 levels.
Look at your graphs. First, they are an extremely insignificant sample. One only goes back 140 years, and the other, which does nothing but display that greenhouse gases are rising, only goes back 1017 years. They did not plot temps on that second graph, because they would have had to show the Medieval Warm Period, and they probably hoped that you did not remember that. But either 140 years or 1017 years is an eye blink in time when examining what causes global warming and cooling. You probably got better marks than me in maths, so you must appreciate that you can prove anything with a graph if you take a small enough sample. Especially if you fudge the graph, and one of your graphs is clearly fudged. You are being lied to Brian, and you could not see it. But I could, and I am just a dumb electrician.
If you agree that there must be other causes of global temperature changes, other than just CO2 making the planet warmer, then where on your graphs are these factors displayed? The graphs appear to show that CO2 and other greenhouse gases must be the only possible causes of global temperature rises.
On the scale of 10,000 year cycles, the earth warms and cools roughly every 1000 years. If humans are causing global warming through the release of CO2, then what caused the other 9 warming periods in the last 10,000 years? There must have been 9 other previously unknown industrialised societies on earth belching CO2 and other greenhouse gases to have made the earth warm to the same levels that they are today? Some of those warming periods were warmer than today. And the same factor of previously unknown industrialised civilisations must have happened to explain the thousands of other more warming periods, occurring almost as regular as clockwork for millions of years.
If rising CO2 and other greenhouse gases causes global temperatures to rise, then what makes these gases suddenly disappear and cause global cooling?
Lastly, the graph I submitted to you a few posts back showed global temps and CO2 levels over 570 million years. Which I think you would agree is a better x-axis baseline for a graph than either 140 years or 1017. That graph clearly displayed that there is no correlation between high levels of CO2 and global temperatures.
You do not have the required permissions to view the files attached to this post.
-
Bogan
- Posts: 948
- Joined: Sat Aug 24, 2019 5:27 pm
Re: Climate Change
You do not have the required permissions to view the files attached to this post.
-
Bogan
- Posts: 948
- Joined: Sat Aug 24, 2019 5:27 pm
Re: Climate Change
Correction. ALL of the previous 9 warming periods in the last 10,000 years were all warmer that they are today. If the graph is accurate, then any reasonable person would conclude that the present, naturally occurring warming period has not reached it's peak. The climate will continue to warm, lifting CO2 levels along with it.
But we live today in a world of socialised science where every scientific climate research institute is government funded. And the primary goal of all public service bureaucracies is to make the case to governments that their particular department is more important, and more deserving of funding than others. This what happened to climate science. An obscure and relatively unimportant branch of publicly funded science saw an opportunity to claim that a naturally occurring event was linked to their socialist humanitarian ideology, which hates anything that makes any money for the white western world, and promotes white guilt over their economic success. That guilt can then be used as an emotional lever to claim that the white western world owes the third world massive amounts of money for supposedly destroying the environment. And if you work for that government funded bureaucracy and you know it is all crap, then you better shut up or you will end up selling Encyclopedia Britannica door to door.
And of course, that proportion of the public who are Brian Ross clones, and have a psychological need to think that they are better in every way to every body else in society, jumped right on the bandwagon. Here was another opportunity for them to strut and preen and virtue signal.
-
sprintcyclist
- Posts: 7007
- Joined: Wed May 07, 2008 11:26 pm
Re: Climate Change
InterestingBogan wrote: ↑Tue Sep 03, 2019 6:30 amCorrection. ALL of the previous 9 warming periods in the last 10,000 years were all warmer that they are today. If the graph is accurate, then any reasonable person would conclude that the present, naturally occurring warming period has not reached it's peak. The climate will continue to warm, lifting CO2 levels along with it.
But we live today in a world of socialised science where every scientific climate research institute is government funded. And the primary goal of all public service bureaucracies is to make the case to governments that their particular department is more important, and more deserving of funding than others. This what happened to climate science. An obscure and relatively unimportant branch of publicly funded science saw an opportunity to claim that a naturally occurring event was linked to their socialist humanitarian ideology, which hates anything that makes any money for the white western world, and promotes white guilt over their economic success. That guilt can then be used as an emotional lever to claim that the white western world owes the third world massive amounts of money for supposedly destroying the environment. And if you work for that government funded bureaucracy and you know it is all crap, then you better shut up or you will end up selling Encyclopedia Britannica door to door.
And of course, that proportion of the public who are Brian Ross clones, and have a psychological need to think that they are better in every way to every body else in society, jumped right on the bandwagon. Here was another opportunity for them to strut and preen and virtue signal.
Right Wing is the Natural Progression.
-
brian ross
- Posts: 6059
- Joined: Thu Apr 19, 2018 6:26 pm
Re: Climate Change

Here we go again, the non-scientist, the non-qualified commentator producing comments about a hideously complex subject which scientists who are qualified to comment about have produced findings which he disagrees with. Sheesh! No wonder there is considered a "war on science" by the conservative side of politics.
The old belief that the Earth is an open system are just that, old beliefs. Today, science realises that the Earth is a closed system. When you burn billions of tonnes of fossil fuels, it's waste has to go somewhere, it doesn't just disappear. Man's use of fossil fuels has exceeded the ability of the Earth's biosphere to absorb the gases produced. The build of CO^2 has created a "glasshouse effect" where heat absorbed from the Sun's rays can no long escape with the result that the atmosphere's temperature has (on average) increased. The result has been hotter summers and colder winters.
There may be minor errors here and there but overall, if we do not stop using fossil fuels in the amounts we are, we are going to be fucked. QED. All the rest is just carping, moaning and whinging that we are going, as a society, have to change our ways. We need less, not more CO^2 in the atmosphere, not more so that means renewables and perhaps even nuclear power.
Time to wake up children. Dream time is over. You need to take responsibility now. Be adults. Tsk, tsk.
Nationalism is not to be confused with patriotism. - Eric Blair
-
Bogan
- Posts: 948
- Joined: Sat Aug 24, 2019 5:27 pm
Re: Climate Change
That is not an argument, Brian, it is just a meaningless declaration.
I am really getting to you, aren't I? You can't counter my arguments which are valid and make sense. All you can do now is to bluster and prevaricate.
The whole HIGW scenario is coming apart at the seams, Brian. The next time you and your comrades are looking for a cause to display your supposed moral and intellectual superiority, you had better check it out first before you jump in boots and all behind a bunch of Elmer Gantry charlatans.
-
brian ross
- Posts: 6059
- Joined: Thu Apr 19, 2018 6:26 pm
Re: Climate Change
Your arguments aren't "getting to me," at all, Bogan. They are pointless and unscientific. When you find a peer reviewed sound scientific paper authored by a real scientist in a renowned journal that refutes the whole Climate Change thesis, get back to you. All you're doing is whinging and moaning.
Personally I don't actually understand why you're so anti-Climate Change - Global Warming is good for the electricity business. It just changes from centralised generation to diverse generation as a model. You should be sitting pretty. Loads of demand for solar power...
Personally I don't actually understand why you're so anti-Climate Change - Global Warming is good for the electricity business. It just changes from centralised generation to diverse generation as a model. You should be sitting pretty. Loads of demand for solar power...
Nationalism is not to be confused with patriotism. - Eric Blair
Who is online
Users browsing this forum: No registered users and 2 guests